Morphologic features of the soil, such as structure, texture, permeability, and consistency, are good predictors of the soil’s hydraulic capacity and suitability for infiltration. In addition, a percolation test should be performed to determine the infiltration rate.
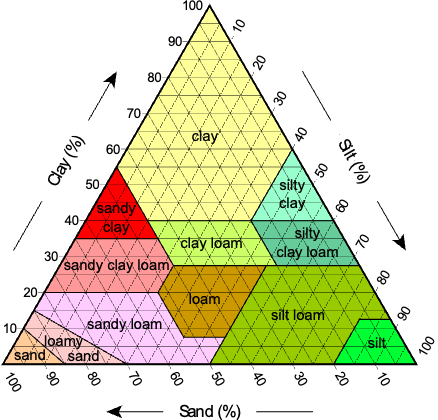
Soil texture refers to the soil’s relative sand, silt, and clay particle proportions. Suitable soils for infiltration typically include sandy soils and loamy soils. These soil types have larger particle sizes and more pore spaces, facilitating water movement through the soil. Sandy soils, particularly, offer excellent infiltration capabilities due to their high permeability. There are several methods to determine soil texture, including using the soil texture triangle or the feel method.
Let us look at the two methods in detail.
Determination of Soil Texture by Jar Test and Soil Texture Triangle
The proportions of particle types are found by suspending a soil sample in water. The following steps can be followed:
Use a clear, clean, empty jar with a tight lid.
Fill the jar halfway with the soil sample. You can use soil from different areas of the intended infiltration area.
Fill the jar nearly to the top with water. Leave some room for shaking.
Tighten the lid and shake the jar for several minutes so that all the particles are in suspension.
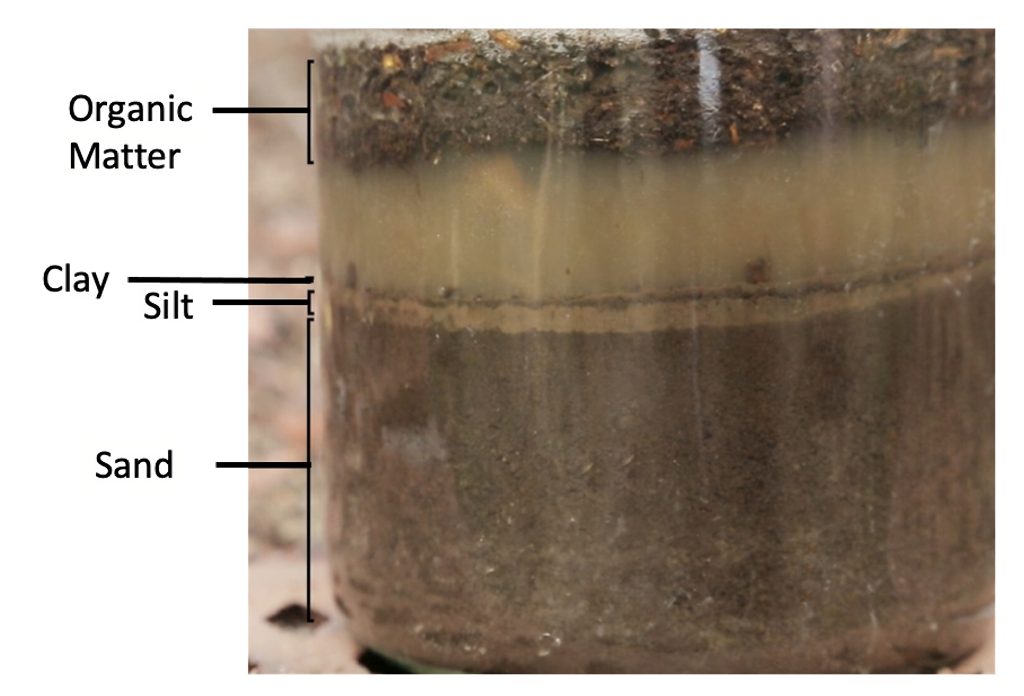
Set your jar soil test aside for several hours, so that the particles can settle. They will separate into 3 layers: clay, silt and sand layers.
Using a ruler, measure the height of each layer and the total height of all three layers. Calculate the relative percentage of each layer of the total layer.
Use the soil texture triangle to estimate the soil texture.
How to interpret the results:
The bottom layer will be the heavier particles, sand, and rocks.
The next layer will be the silt particles.
Above that there are the clay particles.
Organic matter may be floating on the surface of the water.
Let’s practice using the triangle with a real example!
Exercise to Determine the Soil Texture Using the Soil Texture Triangle
A jar test was performed to determine the soil texture of a sample from the area where an infiltration trench is intended to be implemented. The following results were obtained:
Soil Sample
Next, measurements, calculations and interpretation are done:
Measurement of the heights of the different layers.
Sand layer: 2 cm
Silt layer: 0.3 cm
Clay layer: 0.1 cm
Total height of all layers: 2.4 cm
Calculation of the percentages.
Sand layer: % sand = (2 cm / 2.4 cm) x 100 = 83.3%
Silt layer: % silt = (0.3 cm / 2.4 cm) x 100 = 12.5%
Clay layer: % clay = (0.1 cm / 2.4 cm) x 100 = 4.2%
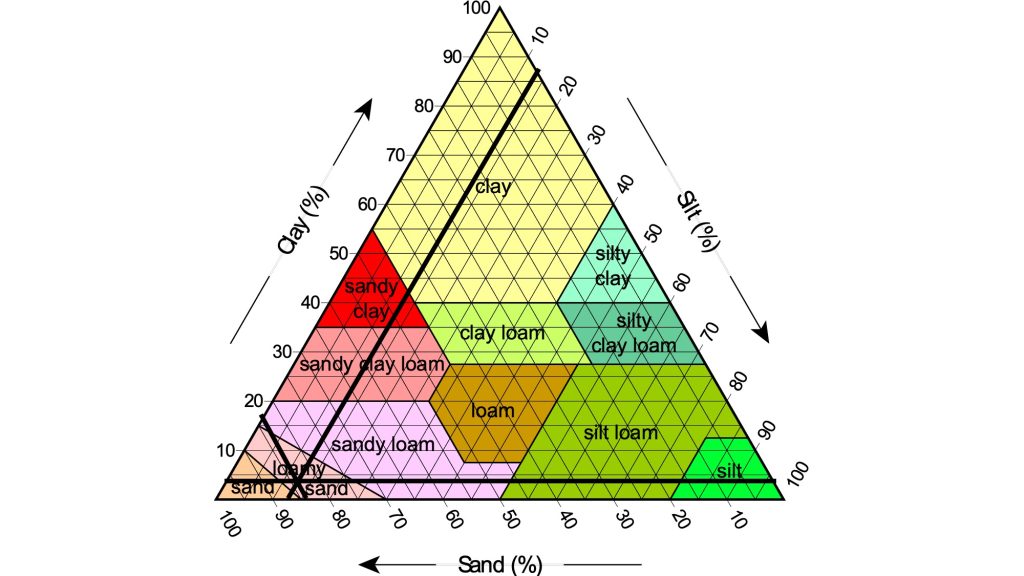
Apply the soil texture triangle:
Soil Texture Triangle with Exercise Results
According to the triangle, the soil sample is loamy sand.
To download a guided step-by-step demonstration of the jar test and application of the soil texture triangle, please visit the Materials tab above for additional information.
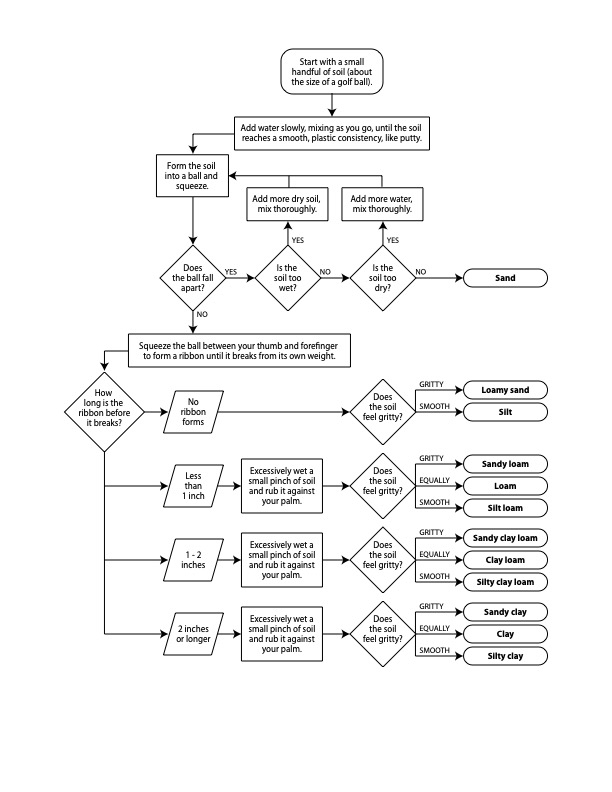
Determination of Soil Texture by Feel Method
The feel method can be used as an alternative to the jar method. The following flow chart can be followed to determine the soil texture by feel.
Soil structure relates to the arrangement of soil particles into aggregates or granules. Well-structured soil with stable aggregates can enhance infiltration by creating interconnected pore spaces that allow water to move through the soil. Good soil structure can be influenced by organic matter, root activity, and land management practices.
Soil Texture in Relation to Soil Structure and Potential for Infiltration
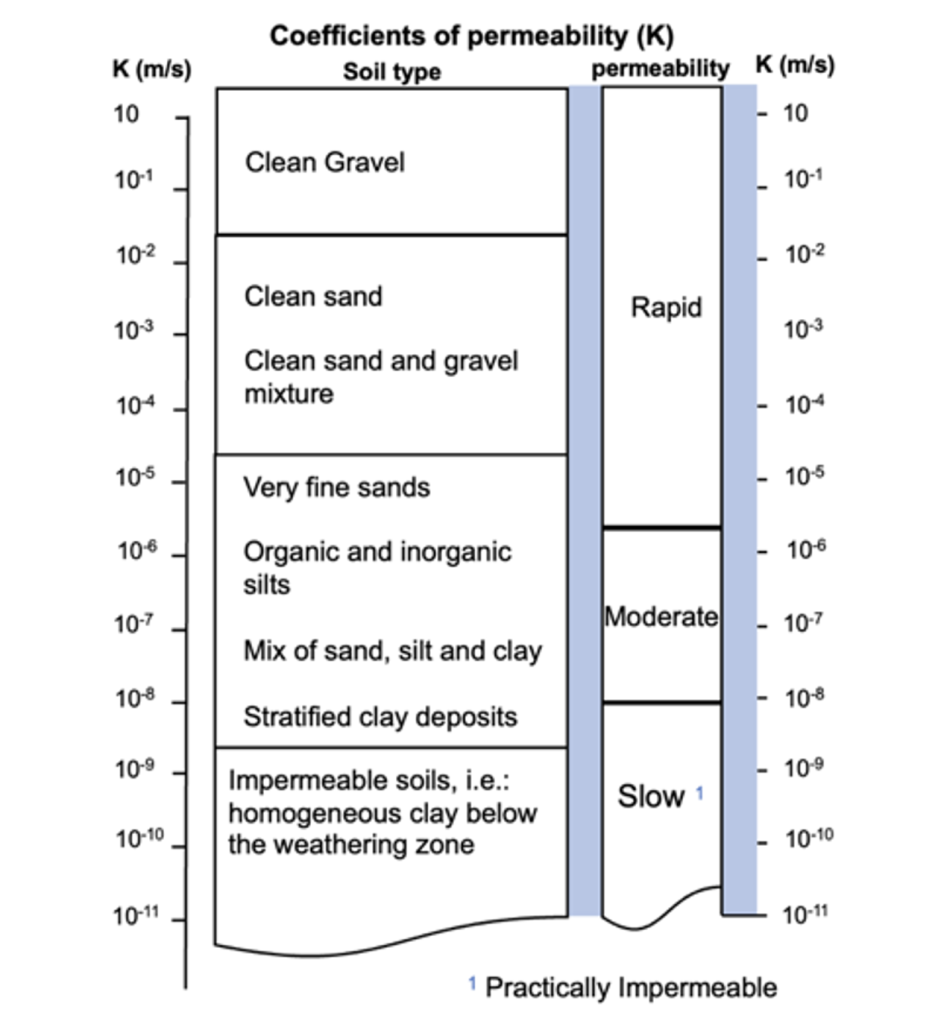
Soil permeability measures how easily water can move through the soil. It is expressed as a permeability rate in millimetres per hour (mm/h) or as a coefficient of permeability k in meters per second (m/s). Soil permeability is strongly influenced by soil texture and structure. Coarse-textured soils with high permeability promote fast infiltration, while fine-textured soils with low permeability, such as clay, tend to impede water movement. Soils generally have several layers, and soil quality often varies from one layer to another. The different layers must be considered as the least permeable layer may limit infiltration.
Soil Permeability in Relation to Soil Type (Source: FAO)
Soil consistency relates to the degree of cohesion and plasticity of the soil, and it is typically categorised into cohesive, granular, and plastic soils.
It is crucial to keep in mind that soil properties are subject to change because of wastewater infiltration. Therefore, the percolation test should be conducted after the soil is fully saturated with water since waterlogged soil has a lower infiltration rate than dry.
During wastewater infiltration, soils are modified by progressive clogging by particles and suspended solids. Sandy soils can be used for more extended periods. When the clogging appears around the drains, it is possible to clean the gravel and the pipes. Some centimetres of soil can be removed and replaced. Soil clogging is often irreversible. However, dry periods and water cleaning can improve the permeability.
Reducing the total mass load of BOD and TSS with wastewater pre-treatment systems reduces or eliminates soil clogging. Higher wastewater loading rates can be applied to soil when the potential for clogging is eliminated. On the other hand, high hydraulic loading that highly treated wastewater may permit can lead to reduced wastewater retention times in the soil and reduce treatment efficiencies. Reduced retention time may be compensated for improved wastewater quality from the pre-treatment system and uniform wastewater application (in space and time) to the soil to ensure that unsaturated flow conditions are maintained below the infiltrative surface.
The following table describes soil textures with related soil structures and recommended hydraulic and organic loading rates considering these characteristics.
Texture
Structure
Hydraulic Loading (m3/m2/d)
Organic Loading (kg/m2/d)
Shape
Grade
BOD = 150
BOD = 30
BOD = 150
BOD = 30
Coarse sand, sand, loamy coarse sand, loamy sand
single grain
structureless
0.033
0.065
4.882
1.953
Fine sand, very fine sand, loamy fine sand, loamy very fine sand
single grain
structureless
0.016
0.041
2.441
1.221
Coarse sandy loam, sandy loam
massive
structureless
0.008
0.024
1.221
0.732
platy
weak
0.008
0.020
1.221
0.635
moderate, strong
–
–
–
–
Prismatic, blocky, granular
weak
0.016
0.028
2.441
0.879
moderate, strong
0.024
0.041
3.662
1.221
Fine sandy loam, very fine sandy loam
massive
structureless
0.008
0.020
1.221
0.635
platy
weak, moderate, strong
–
–
–
–
Prismatic, blocky, granular
weak
0.008
0.024
1.221
0.732
moderate, strong
0.016
0.033
2.441
0.976
Loam
massive
structureless
0.008
0.020
1.221
0.635
platy
weak, moderate, strong
–
–
–
–
Prismatic, blocky, granular
weak
0.016
0.024
2.441
0.732
moderate, strong
0.024
0.033
3.662
0.976
Silt loam
massive
structureless
–
0.008
0.000
0.244
platy
weak, moderate, strong
–
–
–
–
Prismatic, blocky, granular
weak
0.016
0.024
2.441
0.732
moderate, strong
0.024
0.033
3.662
0.976
Sandy clay loam, clay loam, silty clay loam
massive
structureless
–
–
–
–
platy
weak, moderate, strong
–
–
–
–
Prismatic, blocky, granular
weak
0.008
0.012
1.221
0.391
moderate, strong
0.016
0.024
2.441
0.732
Sandy clay, clay, silty clay
massive
structureless
–
–
–
–
platy
weak, moderate, strong
–
–
–
–
Prismatic, blocky, granular
weak
–
–
–
–
moderate, strong
0.008
0.012
1.221
0.391
Suggested Hydraulic and Organic Loading Rates Based on Soil Texture and Structure (Source: Source: “Onsite Wastewater Treatment Systems Manual,” USEPA, 2002)
This website uses cookies so that we can provide you with the best user experience possible. Cookie information is stored in your browser and performs functions such as recognising you when you return to our website and helping our team to understand which sections of the website you find most interesting and useful.
Strictly Necessary Cookies
Strictly Necessary Cookie should be enabled at all times so that we can save your preferences for cookie settings.
If you disable this cookie, we will not be able to save your preferences. This means that every time you visit this website you will need to enable or disable cookies again.
3rd Party Cookies
This website uses Google Tag Manager to collect anonymous information such as the number of visitors to the site, and the most popular pages.
Keeping this cookie enabled helps us to improve our website.
Please enable Strictly Necessary Cookies first so that we can save your preferences!